
Uncertainty about Uncertainty
by Alyssa A. Goodman, May 18, 2020
This essay accompanies the release of an online tool for visualization of IHME COVID-19 forecasts' evolution over time and a community discussion of visualizations created with the tool.
Uncertainty about the future has motivated predictions for millennia. Sometimes, we’re just curious—but other times, we really need to know. As the present pandemic evolves, our urgent societal need to plan has motivated many scientists to predict the spread and effects of the novel coronavirus.
BACKGROUND: TWO BROAD CLASSES OF MODELS
Amongst the many predictions being used by governments to guide policy are two broad classes: infectious disease models based on an understanding of how contagion spreads; and more mechanism-agnostic statistical models informed primarily by data about prior outcomes. To the uninitiated, these approaches, both of which rely on statistical modeling, may sound the same—but they are not.
Models of infectious disease take into account, with varying
levels of complexity: how many, and importantly why, people are susceptible, infected, immune, or have succumbed to a virus at any given point in time and space. The mathematics of these models moves people between groups called "Susceptible," "Exposed," "Infected," and "Removed," and so are often called "SEIR" models. At the philosophical other end of the modeling spectrum, what we call "mechanism-agnostic" approaches use information about cases, testing, hospital admissions, and deaths, to create algorithms that forecast what will happen under various combinations of conditions, given what’s happened under similar conditions in the past. Purely mechanism-agnostic approaches do not factor in medically-informed information about how an infectious disease spreads.

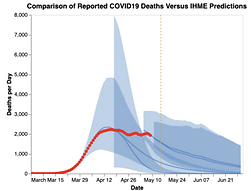
A sample "Daily Deaths' graph from the IHME website, which notes: "Uncertainty is the range of values that is likely to include the correct projected estimate... Larger uncertainty intervals can result from limited data availability, small studies, and conflicting data, while smaller uncertainty intervals can result from extensive data availability, large studies, and data that are consistent across sources. The model presented in this tool has a 95% uncertainty interval and is represented by the shaded area(s) on each chart."
At the moment, there are scores of unrefereed articles in scholarly journals, and hundreds of media articles about predictions from infectious disease models, mechanism-agnostic approaches, and various hybrids, available to policy makers. What isn’t clear, though, is how much faith to put in any of these analyses or forecasts.
For most of the SEIR-style predictions, one sees a range of scenarios offered in journal articles, from a miraculous end to the pandemic due to summer, to a devastating “second wave” to come in the fall of 2020, and waves beyond. Human factors, including both government regulation and compliance with it, are often the most unpredictable variables in infectious disease models, making assigning mathematical uncertainties to such models’ predictions especially fraught.
On the other hand, as time passes, mechanism-agnostic modelers have more and more information about what has happened in places where thousands of people have already died, and data on testing, hospital admissions, and outcomes, are available. While these data are extraordinarily noisy, and subject to reporting biases, they are the only quantitative description we have on how COVID-19 affects modern societies. And, forecasts from mechanism-agnostic models typically do include quantitative estimates of their uncertainty.
Researchers at the Institute for Health Metrics and Evaluation (IHME) created an originally mechanism-agnostic model for COVID-19 back in March. In early May, the same researchers added components of SEIR models to their forecasts. All of the IHME statistical models, and their input data, have been published openly, online, throughout the course of the COVID-19 pandemic. In addition, IMHE has created a now-iconic visualization (see inset above) of daily deaths, with an “uncertainty” band (shaded light red) around a “mean” forecast. In the IHME plot, the mean forecast line (red) is shown as solid for the past and dashed for the future.
Uncertain Uncertainty
There have been very few evaluations of how accurately the IHME models forecast uncertainty. One statistical study, entitled Learning as We Go: An Examination of the Statistical Accuracy of COVID19 Daily Death Count Predictions, by Marchant et al., has looked carefully at what fraction of the time actual deaths were within previous IHME models' 95% confidence interval. The study, as the maps reproduced here suggest, finds that the models are improving over time, but were quite inaccurate in their uncertainty estimates early on.
In their May 15, 2020 New England Journal of Medicine Perspective piece entitled Wrong but Useful — What Covid-19 Epidemiologic Models Can and Cannot Tell Us, Holmdahl and Buckee clearly explain how important it is for those using models to be informed about their limitations.
In order to help the public and policy-makers see how one set of death/day predictions—from IHME models—have changed over time, my visualization colleagues at glue solutions, inc. and I have published an online tool that allows visual inspection of the change in the models—and their forecast uncertainty, over time.

Figure 6 of Marchant et al. preprint, whose caption reads: "Discrepancy between actual death counts and one-step-ahead PIs for specific dates (see sub-figures) for the updated IHME models. The color shows whether the actual death counts were less than the lower limit of the 95% PI (blue), within the 95% PI (white), or above the upper limit of the 95% PI (red). The depth of the red/blue color denotes how many actual deaths were above/below the 95% PI."
The time-based visualization of the evolution of IHME models for various regions reveals:
-
Tremendous variations, from region to region and over time, in whether model predictions are optimistic, pessimistic, or accurate.
-
A lack of long-term overlap between 95% confidence bands, meaning that uncertainty is typically underestimated.
-
Abrupt changes in the models and their associated uncertainty, especially when methodological changes are made.
We offer just a few examples of each of these three effects below, and we hope that many who use the online tool will add their findings to an online conversation about their findings on the 10QViz.org website.
All the sample graphs below are output from the online tool provided by glue solutions. Any model for a particular region shown for a particular date is equivalent to the "Daily Deaths" graph that would have appeared for that region and date on the IHME COVID-19 website. In the online tool's color scheme, the red points show data on actual deaths, and the blue-shaded regions show 95% uncertainty bands around an average forecast (solid blue curve). Note that odd vertical left edges on uncertainty bands are caused by plotting only the "future" portion of what otherwise would be more symmetric distributions.
Example 1: Italy, comparing models from March 25-May 12
This snapshot for Italy shows:
-
models and their uncertainty can change dramatically over time (point #3 above)
-
forecasts have become more pessimistic over time (point #1 above)
-
newer forecasts often fall outside the earlier 95% confidence bands (point #2 above).

Example 2: Texas, early model confidently OVER-estimating the Peak
This snapshot, for Texas, highlights how an early model (shown for March 25) over-estimated the height of the peak in deaths/day, predicting from ~160 to ~220 deaths/day, instead of the ~60 observed.

Example 3: Connecticut, early model confidently UNDER-estimating the Peak, and its duration
This snapshot, for Connecticut, highlights how an early model (shown for March 25) under-estimated the height of the peak in deaths/day, predicting from ~20 to ~80 deaths/day, instead of the >200 observed.

Example 4: Massachusetts, Then and Now
As in Italy (see above):
-
models and their uncertainty can change dramatically over time (point #3 above)
-
forecasts have become more pessimistic over time (point #1 above)
-
newer forecasts often fall outside the earlier 95% confidence bands (point #2 above).

Example 5: Highlighting the effect of adding an SEIR Component
As explained above, in early May, IHME researchers added an "SEIR" component to their previously "mechanism-agnostic" statistical model. We show model predictions just before and just after the change for two sample states, Florida, where the model change had a very dramatic effect--predicting a June peak, and Massachusetts, where the principal effect was to lengthen the current outbreak's decline.


IMPACT OF THE IHME PREDICTIONS' UNCERTAIN UNCERTAINTY
The glue solutions online tool for visualizing the reliability of IHME models' over time, as illustrated by the sample output above, shows that IHME's predictions fall outside the 95% confidence bands much more often than 5% of the time, confirming the earlier Marchant et al. study.
Data scientists and epidemiologists know all-too-well how and why predicting the spread of epidemics can be difficult--and they are also trained to understand how to interpet uncertainty estimates. The lay public, and our politicians, are typically less expert at interpreting forecasts and their uncertainty. This mis-match offers two dangers, one obvious, and the other less-so.
Over-confidence about how well we know the future is the obvious danger of under-appreciating how uncertain predicting uncertainty really is. The more subtle danger concerns so-called "feedback" effects. If too many people rely on a model, and act on its predictions, their behavior may impact the phenomenon the model is trying to predict. That kind of feedback is not a problem for some kinds of predictions--like weather forecasts--where human actions don't change the weather much. But, in the case of the current pandemic, and the extremely-influential IHME model, it is possible that actions taken based on the model--such as shortening, or lengthening, restrictions on movement--will affect the course of the epidemic--the very phenomenon one is seeking to predict.